economicollapseblog | If you know someone that actually believes that the U.S. economy is
in good shape, just show them the statistics in this article. When you
step back and look at the long-term trends, it is undeniable what is
happening to us. We are in the midst of a horrifying economic decline
that is the result of decades of very bad decisions. 30 years ago, the
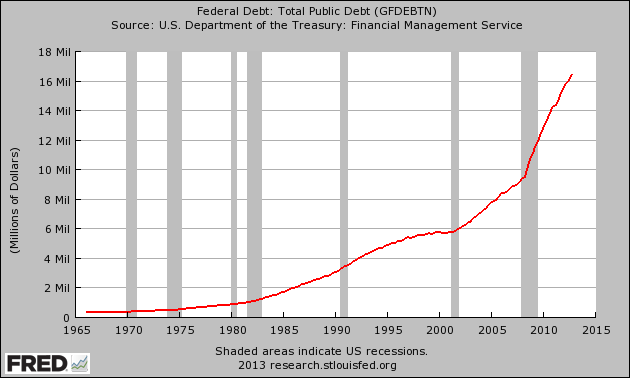
U.S. national debt was about one trillion dollars. Today, it is almost
17 trillion dollars. 40 years ago, the total amount of debt in the
United States was about 2 trillion dollars. Today, it is more than 56
trillion dollars. At the same time that we have been running up all of
this debt, our economic infrastructure and our ability to produce wealth
has been absolutely gutted. Since 2001, the United States has lost
more than 56,000 manufacturing facilities and millions of good jobs have
been shipped overseas. Our share of global GDP declined from 31.8
percent in 2001 to 21.6 percent in 2011. The percentage of Americans
that are self-employed is at a record low, and the percentage of
Americans that are dependent on the government is at a record high. The
U.S. economy is a complete and total mess, and it is time that we faced
the truth.
The following are 40 statistics about the fall of the U.S. economy that are almost too crazy to believe...


2 comments:
http://www.nytimes.com/2013/05/29/business/house-prices-show-largest-gain-in-years.html you'd almost think they were making this stuff up...,
The graph is a bit misleading, because it has a linear vertical scale & without inflation taken out. So the significant cushioning effects of inflation and GDP (I know I know) growth are not visible here.
Post a Comment