 oftwominds | A number of readers kindly forwarded additional data sources to me as followup on last week's entry describing sharply lower deliveries of gasoline.(Why Is Gasoline Consumption Tanking? February 10, 2012)
 The basic thesis here is that petroleum consumption is a key proxy of economic activity. In periods of economic expansion, energy consumption rises. In periods of contraction, consumption levels off or declines.
This common sense correlation calls into question the Status Quo's insistence that the U.S. economy has decoupled from the global ecoomy and is still growing. This growth will create more jobs, the story goes, and expand corporate profits which will power the stock market ever higher.
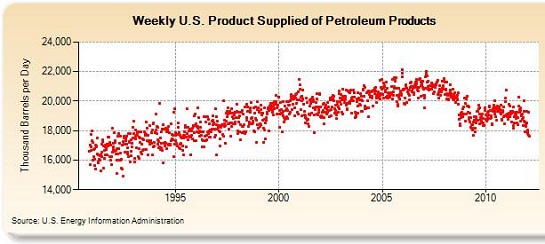
Courtesy of correspondents Bob C. and Mark W., here are links and charts of petroleum consumption, imports/exports, and electricity consumption. Let's start with a chart of total petroleum products, which includes all products derived from petroleum (distillates, fuels, etc.) provided by Bob C. The chart shows the U.S. consumed about 21 million barrels a day (MBD) at the recent peak of economic activity 2005-07; from that peak, "product supplied" has fallen to 18 MBD. The current decline is very steep and has not bottomed.
This recent drop mirrors the decline registered in 2009 as the wheels fell off the global debt-based bubble. Those arguing that the U.S. economy is growing smartly and sustainably have to explain why petroleum consumption looks like 2009 when the economy tipped into a sharp contraction.


0 comments:
Post a Comment